Many disability attorneys and advocates interact with hundreds if not thousands of disability claimants every year. Through these interactions disability representatives inevitability create a mental model of the typical disability recipient and the disability system. Let’s see how much you know about Social Security disability.
- Do more men or women receive disability benefits?
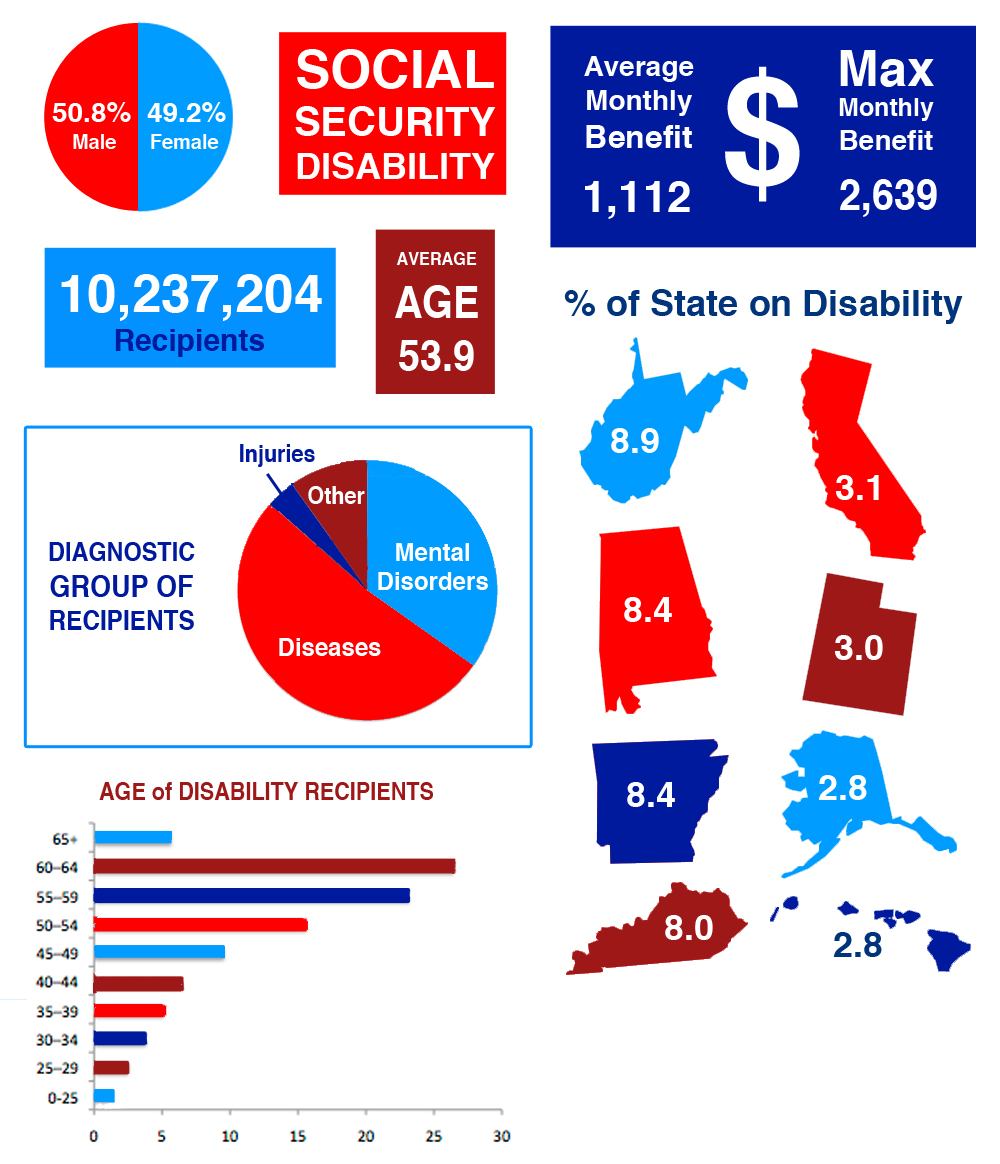
- men
- women
- virtually the same
- What is the average age of a disability recipient?
- 51.2
- 57.8
- 53.9
- 55.1
- Rank the most common types of disabilities as categorized by the SSA
- Mental disorder, disease, injury, other
- Disease, mental disorder, other, injury
- Disease, injury, mental disorder, other
- Injury, disease, other, mental disorder
- Which 4 states have the most disability recipients as a percent of the population?
- Mississippi, Maine, Tennessee, Missouri
- South Carolina, Michigan, Vermont, Louisiana
- New Hampshire, Rhode Island, Oklahoma, North Carolina
- West Virginia, Alabama, Arkansas, Kentucky
- Which 4 states have the fewest disability recipients as a percent of the population?
- Texas, District of Columbia, Colorado, North Dakota
- California, Utah, Alaska, Hawaii
- South Dakota, Arizona, Connecticut, Illinois
- New Jersey, Wyoming, Nevada, Maryland
- What percent of the United States population receives disability benefits?
- 1.9
- 3.2
- 4.7
- 6.8
- How many people received disability in 2015?
- 10,237,204
- 53,928,338
- 25,491,827
- 3,719,482
- What was the average monthly benefit amount in 2015?
- $1,112
- $1,289
- $837
- $943
- What is maximum monthly benefit amount in 2016?
- $2,639
- $2,642
- $2,533
- $2,513
Hopefully the above questions shed light on who is currently receiving disability and can aid attorneys when deciding whether a prospective claimant has a disability claim. Veteran SSD representatives are likely not surprised that recipients are split by gender or have an average age of about 55. Conversely, some of the data may be surprising to attorneys and aid in tweaking their criteria for taking a future claimant.
There are some attorneys who only help individuals between the ages of 50-64. This is because the law states that individuals 50+ only need to prove the inability to preform his/her current job, not any job. Looking at the data in the below image, the same percent of people 40-49 as people 50-54 receive disability benefits.
Similarly, a lot of representatives are hesitant to take a mental disability claim because the medical evidence and visible evidence can be more subjective. Surprising to many Social Security disability attorneys/advocates, 34.8% of disability recipients were awarded for a mental disability.
Next time you decide whether or not to take a disability case perhaps you will consider the above data.
Answers: C, C, B, D, B, C, A, A, A